
BRAT Model Logic
This page describes the inputs and logic that go into producing each of the BRAT outputs described in the Working with BRAT Outputs page. An understanding of the model logic will help users to query the data to understand what the model outputs mean, and how their values are calculated. This also allows the user to refine model results for areas of interest based on the reliability of the input data for that area.
Capacity Estimates
To estimate the capacity of a riverscape to support dam building activity, BRAT attempts to addresses four primary questions:
- Is there water to dam in order to create a pond?
- Is there suitable dam building material (vegetation) near the stream?
- Can dams be built at low flows?
- Can dams persist during typical floods (e.g., a 2-year recurrence interval flood)?
Is there water to dam? To address this question, the model uses stream network attributes that indicate flow regime. For example, if flow is perennial, there is always water available, whereas if flow is ephemeral, its not likely that there is enough water to maintain a pond year round. In the BRAT runs performed with freely available national data, the Nation Hydrography Dataset (NHD) produced by the USGS is used. This dataset contains an attribute, ReachCode with a numeric value that indicates the type of flow. Using this attribute, the drainage network can be reduced down to reaches that are likely to have enough water to support beaver ponds.
Is there suitable dam building material? To address this question, BRAT assigns a suitability score to each vegetation type present in the input dataset. The model uses raster data, where each cell represents a type or class of vegetation. A lookup table is then created that is used to assign each cell a suitability value based on the vegetation.
| Value | Suitability | Examples |
|---|---|---|
| 0 | Unsuitable | Ice, Bare Ground |
| 1 | Barely Suitable | Grasses, Sage Brush |
| 2 | Moderately Suitable | Conifer |
| 3 | Suitable | Deciduous Shrubs |
| 4 | Preferred | Aspen, Willow |
These values are then summarized (averaged) within 30 m of each stream segment (streamside vegetation) and 100 m of each segment (this distance beaver are generally willing to travel outside of channels to find material), creating two overall vegetation suitability scores for each stream segment (one for streamside vegetation and one for riparian and upland vegetation). In the BRAT runs performed with freely available national data, we use LANDFIRE as the vegetation input. LANDFIRE consist of various datasets generated by classifying LANDSAT imagery. For BRAT, we use an existing vegetation classification (EVT) and a historic/potential vegetation classification (BPS) to get at existing and historic vegetation suitability.
Can dams be built at low flows? This question is addressed using stream power, a measure of flow competence or strength. For the area where BRAT is being run, regional "hydrologic curves" are used to scale base or low flow values with the contributing drainage area of the stream segment. Stream power is then calculated as the product of flow (Q), channel slope (S), density of water (
Empirical observations were used to determine the low flow stream power at which dams CAN be built, the range of stream power where they can PROBABLY be built, and values above which they CANNOT be built.
| Low Flow | |
|---|---|
| 0 - 160 | Can Build Dam |
| 160 - 185 | Can Probably Build Dam |
| >185 | Cannot Build Dam |
Can dams persist during typical floods? Similar to low flow, BRAT uses regional hydrologic curves to calculate the 2-year recurrence interval flood flow (Q2), scaled based on contributing drainage area. Stream power is then calculated for these flood flows. Again, empirical observations were used to parameterize the range of stream power values at which dams persist, occasionally breach, occasionally blow out, or certainly blow out.
| Q2 | |
|---|---|
| 0 - 1100 | Dam Persists |
| 1100 - 1400 | Potential Dam Breach |
| 1400 - 2200 | Potential Dam Blowout |
| >2200 | Dam Blowout |
In the case of both low and high flow, categorical ambiguity is dealt with using fuzzy logic, described in the following section on how the model works.
Calculating Capacity
Capacity estimates are driven primarily by the vegetation, with the hydrology used to adjust (reduce) estimates if flow is a limiting factor (i.e., if floods cause dams to breach or blow out). In cases where channel slope is very low, capacity as also adjusted downward, as a single dam can back water up for a longer distance, reducing capacity. The first part of the capacity model, therefore, is based on the two vegetation suitability values (streamside and riparian/upland). These two values are combined in a fuzzy inference system (FIS). To account for categorical ambiguity, a particular vegetation suitability value can have partial membership in more than one category (e.g., 70% moderately suitable and 30% suitable). A rule table is then applied to the input values, and membership in output categories calculated. Finally, a "defuzzification" algorithm converts that membership into a discrete value of dams/km.
Vegetation Fuzzy Inference System
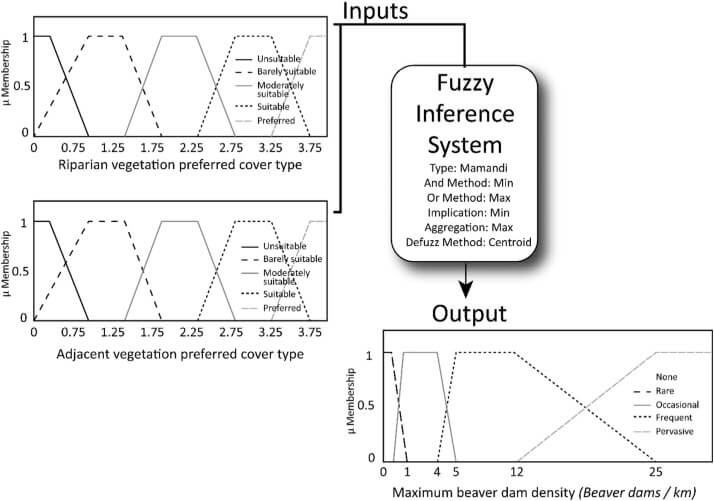
Vegetation FIS Rule Table
| If | Inputs | Output | ||||
|---|---|---|---|---|---|---|
| Suitability of streamside vegetation | Suitability of riparian/upland vegetation | Dam density capacity | ||||
| Rules | 1 | Unsuitable | & | Unsuitable | , then | None |
| 2 | Barely suitable | & | Unsuitable | , then | Rare | |
| 3 | Moderately suitable | & | Unsuitable | , then | Occasional | |
| 4 | Suitable | & | Unsuitable | , then | Occasional | |
| 5 | Preferred | & | Unsuitable | , then | Occasional | |
| 6 | Unsuitable | & | Barely suitable | , then | Rare | |
| 7 | Barely suitable | & | Barely suitable | , then | Occasional | |
| 8 | Moderately suitable | & | Barely suitable | , then | Occasional | |
| 9 | Suitable | & | Barely suitable | , then | Frequent | |
| 10 | Preferred | & | Barely suitable | , then | Frequent | |
| 11 | Unsuitable | & | Moderately suitable | , then | Occasional | |
| 12 | Barely suitable | & | Moderately suitable | , then | Rare | |
| 13 | Moderately suitable | & | Moderately suitable | , then | Frequent | |
| 14 | Suitable | & | Moderately suitable | , then | Frequent | |
| 15 | Preferred | & | Moderately suitable | , then | Pervasive | |
| 16 | Unsuitable | & | Suitable | , then | Rare | |
| 17 | Barely suitable | & | Suitable | , then | Frequent | |
| 18 | Moderately suitable | & | Suitable | , then | Frequent | |
| 19 | Suitable | & | Suitable | , then | Frequent | |
| 20 | Preferred | & | Suitable | , then | Pervasive | |
| 21 | Unsuitable | & | Preferred | , then | Occasional | |
| 22 | Barely suitable | & | Preferred | , then | Frequent | |
| 23 | Moderately suitable | & | Preferred | , then | Frequent | |
| 24 | Suitable | & | Preferred | , then | Pervasive | |
| 25 | Preferred | & | Preferred | , then | Pervasive |
After the vegetation FIS is run, the output of that FIS is combined with the other model inputs (low flow stream power, flood stream power, and reach slope) in another combined FIS, associated with another rule table. The output of the combined FIS is the final prediction for the capacity of the segment to support dams (dams/km). However, in some cases rivers get large enough that beaver no longer try to dam them because they can make a good living by building dens in the banks and using the natural depth of the river for caches. Therefore, a final filter is sometimes added, where above a specified drainage area it is assumed that rivers are large enough that beavers don't need to build dams, and the capacity of all segments with that drainage area or larger is set to zero.
Combined Fuzzy Inference System
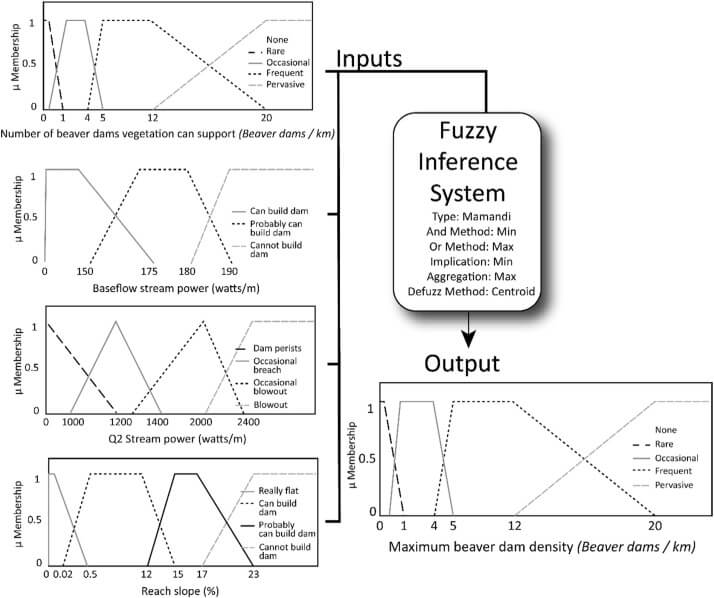
Combined FIS Rule Table
| If | Inputs | Output | ||||||||
|---|---|---|---|---|---|---|---|---|---|---|
| Vegetative dam density capacity (FIS) | Baseflow stream power | 2-year flood stream power | Reach slope (%) | Dam density capacity | ||||||
| Rules | 1 | Unsuitable | & | - | & | - | & | - | , then | None |
| 2 | - | & | Cannot build dam | & | - | & | - | , then | None | |
| 3 | - | & | - | & | - | & | Cannot build dam | , then | None | |
| 4 | Rare | & | Can build dam | & | Dam persists | & | - | , then | Rare | |
| 5 | Occasional | & | Can build dam | & | Dam persists | & | - | , then | Occasional | |
| 6 | Frequent | & | Can build dam | & | Dam persists | & | Can build dam | , then | Frequent | |
| 7 | Frequent | & | Can build dam | & | Dam persists | & | Probably can build dam | , then | Occasional | |
| 8 | Pervasive | & | Can build dam | & | Dam persists | & | Really flat | , then | Pervasive | |
| 9 | Pervasive | & | Can build dam | & | Dam persists | & | Can build dam | , then | Pervasive | |
| 10 | Pervasive | & | Can build dam | & | Dam persists | & | Probably can build dam | , then | Occasional | |
| 11 | Rare | & | Can build dam | & | Occasional breach | & | - | , then | Rare | |
| 12 | Occasional | & | Can build dam | & | Occasional breach | & | - | , then | Occasional | |
| 13 | Frequent | & | Can build dam | & | Occasional breach | & | Can build dam | , then | Frequent | |
| 14 | Frequent | & | Can build dam | & | Occasional breach | & | Probably can build dam | , then | Occasional | |
| 15 | Pervasive | & | Can build dam | & | Occasional breach | & | Really flat | , then | Occasional | |
| 16 | Pervasive | & | Can build dam | & | Occasional breach | & | Can build dam | , then | Frequent | |
| 17 | Pervasive | & | Can build dam | & | Occasional breach | & | Probably can build dam | , then | Occasional | |
| 18 | Rare | & | Can build dam | & | Occasional blowout | & | - | , then | Rare | |
| 19 | Occasional | & | Can build dam | & | Occasional blowout | & | - | , then | Occasional | |
| 20 | Frequent | & | Can build dam | & | Occasional blowout | & | Can build dam | , then | Frequent | |
| 21 | Frequent | & | Can build dam | & | Occasional blowout | & | Probably can build dam | , then | Occasional | |
| 22 | Pervasive | & | Can build dam | & | Occasional blowout | & | Really flat | , then | Occasional | |
| 23 | Pervasive | & | Can build dam | & | Occasional blowout | & | Can build dam | , then | Frequent | |
| 24 | Pervasive | & | Can build dam | & | Occasional blowout | & | Probably can build dam | , then | Occasional | |
| 25 | Rare | & | Can build dam | & | Blowout | & | - | , then | None | |
| 26 | Occasional | & | Can build dam | & | Blowout | & | - | , then | Rare | |
| 27 | Frequent | & | Can build dam | & | Blowout | & | Can build dam | , then | Rare | |
| 28 | Frequent | & | Can build dam | & | Blowout | & | Probably can build dam | , then | None | |
| 29 | Pervasive | & | Can build dam | & | Blowout | & | Really flat | , then | Rare | |
| 30 | Pervasive | & | Can build dam | & | Blowout | & | Can build dam | , then | Occasional | |
| 31 | Pervasive | & | Can build dam | & | Blowout | & | Probably can build dam | , then | Rare | |
| 32 | Rare | & | Probably can build dam | & | Occasional breach | & | - | , then | Rare | |
| 33 | Occasional | & | Probably can build dam | & | Occasional breach | & | - | , then | Occasional | |
| 34 | Frequent | & | Probably can build dam | & | Occasional breach | & | Can build dam | , then | Frequent | |
| 35 | Frequent | & | Probably can build dam | & | Occasional breach | & | Probably can build dam | , then | Occasional | |
| 36 | Pervasive | & | Probably can build dam | & | Occasional breach | & | Really flat | , then | Occasional | |
| 37 | Pervasive | & | Probably can build dam | & | Occasional breach | & | Can build dam | , then | Frequent | |
| 38 | Pervasive | & | Probably can build dam | & | Occasional breach | & | Probably can build dam | , then | Occasional | |
| 39 | Rare | & | Probably can build dam | & | Occasional blowout | & | - | , then | Rare | |
| 40 | Occasional | & | Probably can build dam | & | Occasional blowout | & | - | , then | Occasional | |
| 41 | Frequent | & | Probably can build dam | & | Occasional blowout | & | Can build dam | , then | Occasional | |
| 42 | Frequent | & | Probably can build dam | & | Occasional blowout | & | Probably can build dam | , then | Rare | |
| 43 | Pervasive | & | Probably can build dam | & | Occasional blowout | & | Really flat | , then | Occasional | |
| 44 | Pervasive | & | Probably can build dam | & | Occasional blowout | & | Can build dam | , then | Frequent | |
| 45 | Pervasive | & | Probably can build dam | & | Occasional blowout | & | Probably can build dam | , then | Occasional | |
| 46 | Rare | & | Probably can build dam | & | Blowout | & | - | , then | None | |
| 47 | Occasional | & | Probably can build dam | & | Blowout | & | - | , then | Rare | |
| 48 | Frequent | & | Probably can build dam | & | Blowout | & | Can build dam | , then | Rare | |
| 49 | Frequent | & | Probably can build dam | & | Blowout | & | Probably can build dam | , then | None | |
| 50 | Pervasive | & | Probably can build dam | & | Blowout | & | Really flat | , then | Rare | |
| 51 | Pervasive | & | Probably can build dam | & | Blowout | & | Can build dam | , then | Occasional | |
| 52 | Pervasive | & | Probably can build dam | & | Blowout | & | Probably can build dam | , then | Rare |
The capacity model is applied using the existing vegetation layer, as well as the historic/potential vegetation layer, giving an estimate for each stream segment for existing dam capacity as well as historic or potential dam capacity.
Risk of Undesirable Dams
Risk of undesirable dams for each stream segment is based on the segment's capacity to support dams, its proximity to human infrastructure, and land use of the riverscape surround the stream segment. The model calculates the distance to different types of infrastructure (roads and road crossings, railroads, and canals and diversion points), and this information is recorded in attributes of the stream segment. Similarly to assigning vegetation suitability to each pixel based on land cover classification, a lookup table is used to assign a land use intensity value from 0 (no land use) to 1 (high intensity land use). The value of the pixels surrounding each segment is averaged to calculate an overall land use intensity value associated with the segment, which is recorded in the segment attributes.
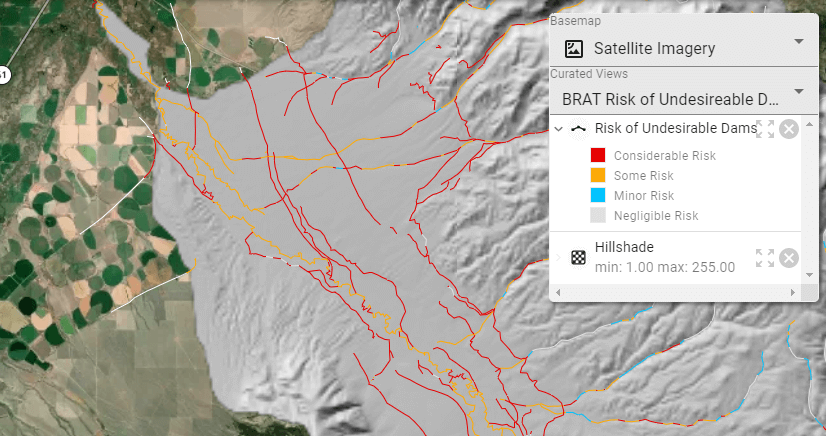
The risk for each segment is then assessed using the following logic:
Negligible Risk:
- Nearest infrastructure is more than 300 meters away OR
- Existing dam capacity is zero
Minor Risk:
- Nearest infrastructure is within 100 meters and existing dam capacity is more than 0 dams/km but less than 5 dams/km
- Nearest infrastructure is 100 - 300 meters away or land use is agricultural, and existing dam capacity is greater than 0 dams/km
Some Risk:
- Nearest infrastructure is within 30 meters or land use is urban, and existing dam capacity is more than 0 dams/km but less than 5 dams/km
- Nearest infrastructure is within 100 meters and existing dam capacity is at least 5 dams/km
Considerable Risk:
- The reach is on a canal
- Nearest infrastructure is within 30 meters or land use is urban, and existing dam capacity is at least 5 dams/km
Restoration or Conservation
Restoration and conservation opportunities is a management layer that combines the risk of undesirable dams outputs and current land use with existing and historic dam capacity outputs. The model logic described below is used to separate each stream reach into one of four categories that provide guidance on the feasibility and level of effort that would be required to implement beaver restoration or conservation.
Easiest - Low-Hanging Fruit:
- Risk of undesirable dams is "negligible" or "minor"
- Existing Capacity estimates are at least "Occasional"
- Existing Capacity is three dams or fewer less than the Historic Capacity.
Straight Forward - Quick Return:
- Risk of undesirable dams is "negligible" or "minor"
- Existing Capacity estimate is greater than "None" and Historic Capacity estimate is "Frequent" or "Pervasive"
- Existing Capacity is three dams or fewer less than the Historic Capacity
- Land Use is suitably low for beavers to return (75% or greater "Very Low" land use, less than 10% "High Land Use")
Strategic - Long-term Investment:
- Risk of undesirable dams is "negligible" or "minor"
- Existing Capacity estimate is "None" or "Rare" (0-1) and Historic Capacity estimate is "Occasional" or higher
- Land Use is suitably low for beavers to return (75% or greater "Very Low" land use, less than 10% "High Land Use")
Other:
- streams that don't fit into the other categories. Such areas are primarily streams where Risk of undesirable dams is classified as "Some" or "Considerable".
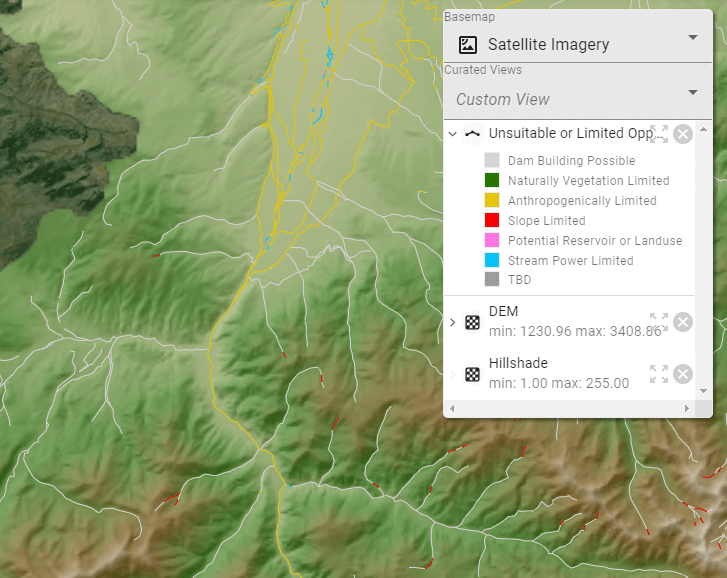
Unsuitable or Limited Opportunities
For areas where dam building potential is limited or impossible, this layer identifies the type of limitation based on the logic outlined below.
Anthropogenically Limited:
- Capacity from the vegetation FIS based on Historic Vegetation is greater than 0
- Slope is not a limiting factor (< 0.23)
- Capacity from the vegetation FIS based on Existing Vegetation is 0, indicating high levels of anthropogenic land use ("Land Use" > 0.3)
Stream Power Limited:
- Capacity from the vegetation FIS based on Historic Vegetation and Existing Vegetation is greater than 0
- Slope is not a limiting factor (< 0.23)
- Capacity based on combined FIS is 0 because stream power at low flow is too high for dam building or because stream power at high flows is too high for dams to persist.
Slope Limited:
- Capacity from the vegetation FIS based on Historic Vegetation is greater than 0
- Slope is too steep for beaver to build dams (>= 0.23)
Potential Reservoir or Land Use Change:
- Capacity from the vegetation FIS based on Historic Vegetation is "None" (0)
- Capacity from the vegetation FIS based on Existing Vegetation is greater than 0
Naturally Vegetation Limited:
- Capacity from the vegetation FIS based on Historic Vegetation and Existing Vegetation is "None" (0)
Stream Size Limited:
- Capacity is 0 because the stream is too large for dam building (exceeds the maximum drainage area threshold)
Dam Building Possible:
- Capacity from the vegetation FIS based on Historic Vegetation is greater than 0
- Slope is not a limiting factor (< 0.23)
- Existing capacity based on combined FIS is greater than 0