
Working with BRAT Outputs
The majority of users of BRAT will not actually run BRAT themselves, but instead will download BRAT outputs and summary products for use in beaver-related stream conservation and restoration efforts. In the text and videos tutorials below, we walk through various ways to interact with the BRAT outputs. We cover each of the outputs that BRAT produces, provide lookup tables for investigative purposes, and provide illustrative videos to help access and interrogate the outputs.
The BRAT Default Symbology
The sections below describe the curated BRAT outputs that are visualized by default using the legends shown. The field within the attribute table that is used to symbolize the particular output is shown in parentheses after the output description.

Capacity Outputs
The capacity output layers include outputs that describe:
- existing capacity for beaver dam density (
oCC_EXfield) - historic capacity for beaver dam density (
oCC_HPEfield) - existing potential complex size (
mCC_EX_CTfield) - historic potential complex size (
mCC_HPE_CTfield)
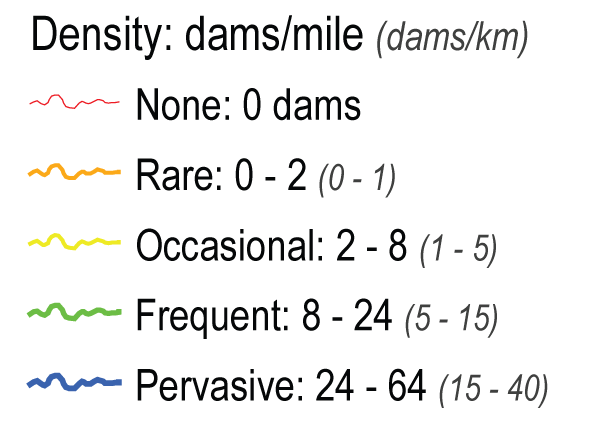
Existing and Historic Capacity
The capacity model produces two values for each stream segment: the density of dams that the segment can support now, and the density of dams that it could support historically. For display, these values are binned and symbolized using the color scheme below (note, while the outputs are binned for display, each ~300 m reach has a specific continuous dam density output). Within the attribute table of the stream network output, the existing capacity value is found in the oCC_EX field and historic capacity is found in the oCC_HPE field. These values represent modeled beaver dam capacity as dams per kilometer or mile for the stream network segment.
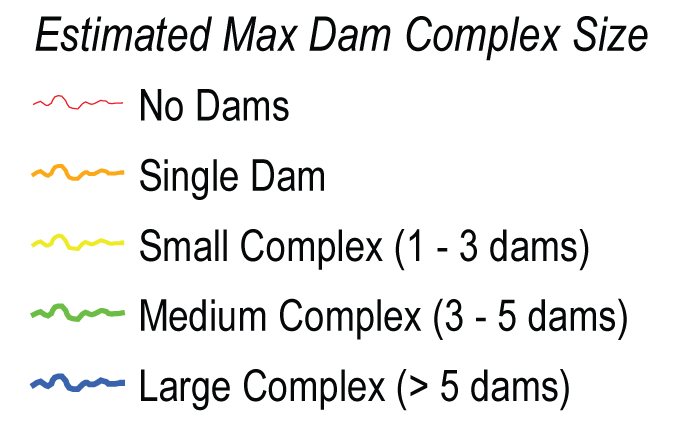
Dam Complex Size
In addition, the capacity outputs and reach lengths were used to report estimated dam complex size mCC_EX_CT (for existing) and mCC_HPE_CT (for historic) fields in the attribute table. This is a modeled maximum number of the dams on that particular segment of the stream network. The following color scheme is used to illustrate these outputs:
Management Outputs
The management output layers include outputs that describe:
- the limiting factors which contribute to unsuitable or limited beaver dam opportunities (
LimitationID&Limitationfields in the attribute table) - risk categories which are based on land use and anthropogenic proximity (
RiskID&Riskfields) - a measure of the effort exhibited to perform restoration or conservation in the segment (
OpportunityID&Opportunityfields)
Unsuitable or Limited Beaver Dam Opportunities
(Limitation) Identifies areas where beaver cannot build dams now, and also differentiates stream segments into anthropogenically and naturally limited areas. The logic for this output combines comparisons of existing and historic dam building capacity with slope and drainage area thresholds to determine potential limitations to dam building. The following color scheme is used to illustrate these distinctions:
(THIS LEGEND NEEDS TO BE UPDATED)

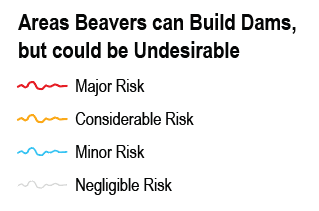
Risk of Undesirable Dams
Risk provides a conservative estimate of risk of dam building activity to human infrastructure. The model calculates the distance from each stream segment to the nearest of various types of infrastructure (roads, railroads, canals, etc.), which are represented as geospatial inputs. This information on proximity to infrastructure is combined with dam building capacity outputs and land use in the riverscape surrounding each segment to estimate the potential risk that could result from dam building activity based on the logic presented here.
(THIS LEGEND NEEDS TO BE UPDATED)
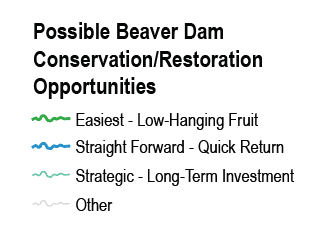
Restoration or Conservation Opportunities
(Opportunity) identifies levels of effort required for establishing beaver dams on the landscape. This output is based on comparison between historic and existing dam building capacity, the risk of undesirable dams, and the land use in the riverscape surrounding stream segments based on this model logic.
(THIS LEGEND NEEDS TO BE UPDATED)
The BRAT Attribute Table
This section lists and describes all of the attributes associated with network segments after BRAT has been run.