Algorithm
The Hydrologic Context Tool is a network model that estimates the baseflow and typical flood (two-year recurrence interval) discharges, and their associated stream power values for every reach of a drainage network within a riverscape. Discharge is calculated using either a simple regression equation generated using nearby stream gages to relate upstream contributing drainage area to discharge, or a regional regression equation pulled from the USGS StreamStats data, which use a variety of variables (e.g., precipitation, elevation, land cover, etc.) in addition to drainage area to estimate discharge values. Stream power (Ω) is then calculated as
Where ρ is the density of water (1000 kg/m3), g is acceleration due to gravity (9.81 m/s2) Q is discharge (m3/s) and S is the reach slope (m/m). Units of stream power are watts, and the value represents the energy available to do work (e.g., sediment transport). Each reach segment has an attribute with its drainage area value and reach-average slope that are used to scale estimates of discharge and stream power across the basin.
Discharge values are stored in outputs in units of ft3/s (cfs), but are converted to m3/s in the background to calculate stream power.
StreamStats Equations
StreamStats regression equations are calculated using long term datasets from gaged streams within basins, allowing for the estimation of flow in non-gaged streams. We take the equations for each basin and add them to a hydraulics equations database in the model code. We then define and add values for each variable in the equations (e.g., elevation, slope, ect.). For these values, we use a single, average value at the HUC8 watershed scale. The drainage area, which varies at each reach, then scales the estimated discharge values (i.e., discharge increases with drainage area).
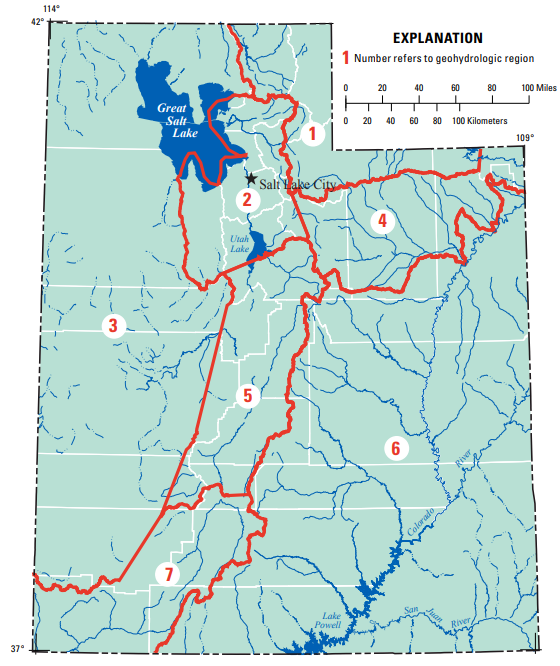
Figure 1. The different geohydrologic regions used by StreamStats to calculate regression equations in Utah. This figure was pulled from a USGS report by Wilkowske et. Al, 2011.
Regression Equations
In basins where Stream Stats equations have not been added to our database or where they don't exist yet, we generate simple drainage area-based regressions. For a given HUC8 watershed, we intersect the watershed boundary with USGS gages to find which gages are within the basin. If there are fewer than 10, we scale up to the next larger watershed scale (e.g., from HUC8 to HUC6) until there are at least 10 gages. We obtain base flow and two-year recurrence interval flow values from the gage data and relate it to the gage’s drainage area, generating a linear regression. For each regression, we test a power function and a linear function and select the function with the higher correlation coefficient. This function is then applied to all HUC8 watersheds within the final selection extent (e.g., the HUC8, HUC6, or HUC4), added to the database, and used to estimate flows in the associated basins.